Dan Barker has an Easter Challenge to any Christian to come up with a seamless account of what happened on the day of the Resurrection.
The conditions of the challenge are simple and reasonable. In each of the four Gospels, begin at Easter morning and read to the end of the book: Matthew 28, Mark 16, Luke 24, and John 20-21. Also read Acts 1:3-12 and Paul’s tiny version of the story in I Corinthians 15:3-8. These 165 verses can be read in a few moments. Then, without omitting a single detail from these separate accounts, write a simple, chronological narrative of the events between the resurrection and the ascension: what happened first, second, and so on; who said what, when; and where these things happened.
Since the gospels do not always give precise times of day, it is permissible to make educated guesses. The narrative does not have to pretend to present a perfect picture–it only needs to give at least one plausible account of all of the facts. Additional explanation of the narrative may be set apart in parentheses. The important condition to the challenge, however, is that not one single biblical detail be omitted.
Andy Bannister has this description, which really is consistent with every detail, and supposed contradiction.
What is the problem with this method that Andy uses? It is helpful to consider a similar situation that arrises in mathematics, in the process of regression.
Regression
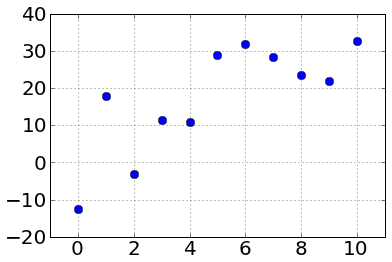
In linear regression, I might have, say, a handful of data points:
| X | Y |
| 0.0 | -12.5 |
| 1.0 | 17.9 |
| 2.0 | -3.2 |
| 3.0 | 11.4 |
| 4.0 | 10.8 |
| 5.0 | 28.8 |
| 6.0 | 31.8 |
| 7.0 | 28.3 |
| 8.0 | 23.4 |
| 9.0 | 21.9 |
| 10.0 | 32.7 |
Which is plotted as

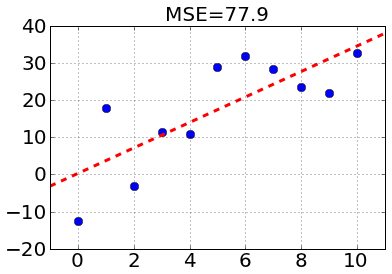
When we do a linear regression, we fit to a standard “y=mx+b” form. For this data, the best fit is
y=3.4 x + 0.27,
with a mean squared error of 77.9.

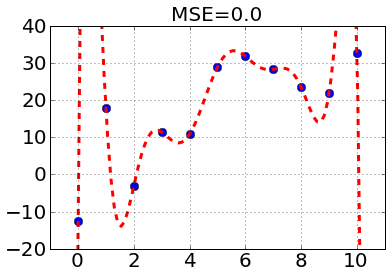
Overall, not a bad looking fit. However, if we fit to a 10-th power polynomial, we can get even better!
            10          9          8         7         6         5
-0.0007039 x  + 0.0363 x - 0.8051 x + 10.04 x - 77.13 x + 376.5 x

         4        3        2
 - 1159 x + 2152 x - 2163 x + 891.8 x - 12.54
with a Mean Squared Error of Zero!!!

In the field of statistics, this is referred to as over-fitting, and is the result of fitting the noise. In other words, it is fitting the meaningless differences from one point to another by adding a tunable parameter for each detail in the data. With each new parameter we get a “better” fit, by the criterion of mean squared error, but we lose sight of the meaning. This is the mathematical equivalent of losing sight of the forest for the trees.
Back to the Resurrection
If we look at Andy Bannister’s very clever solution, we notice something quite interesting: for every single difference between the Gospel accounts, he adds a detail not found in the story to explain it. One can pretty much do this for any two accounts that don’t say logically contradictory things, and can be seen as an example of over-fitting. I think it highlights two things:
1) The challenge is probably not a very good one. One can Rube-Goldberg a story together to fit any amount of details
2) People will go to great lengths harmonizing something that they have a vested interest in believing.
